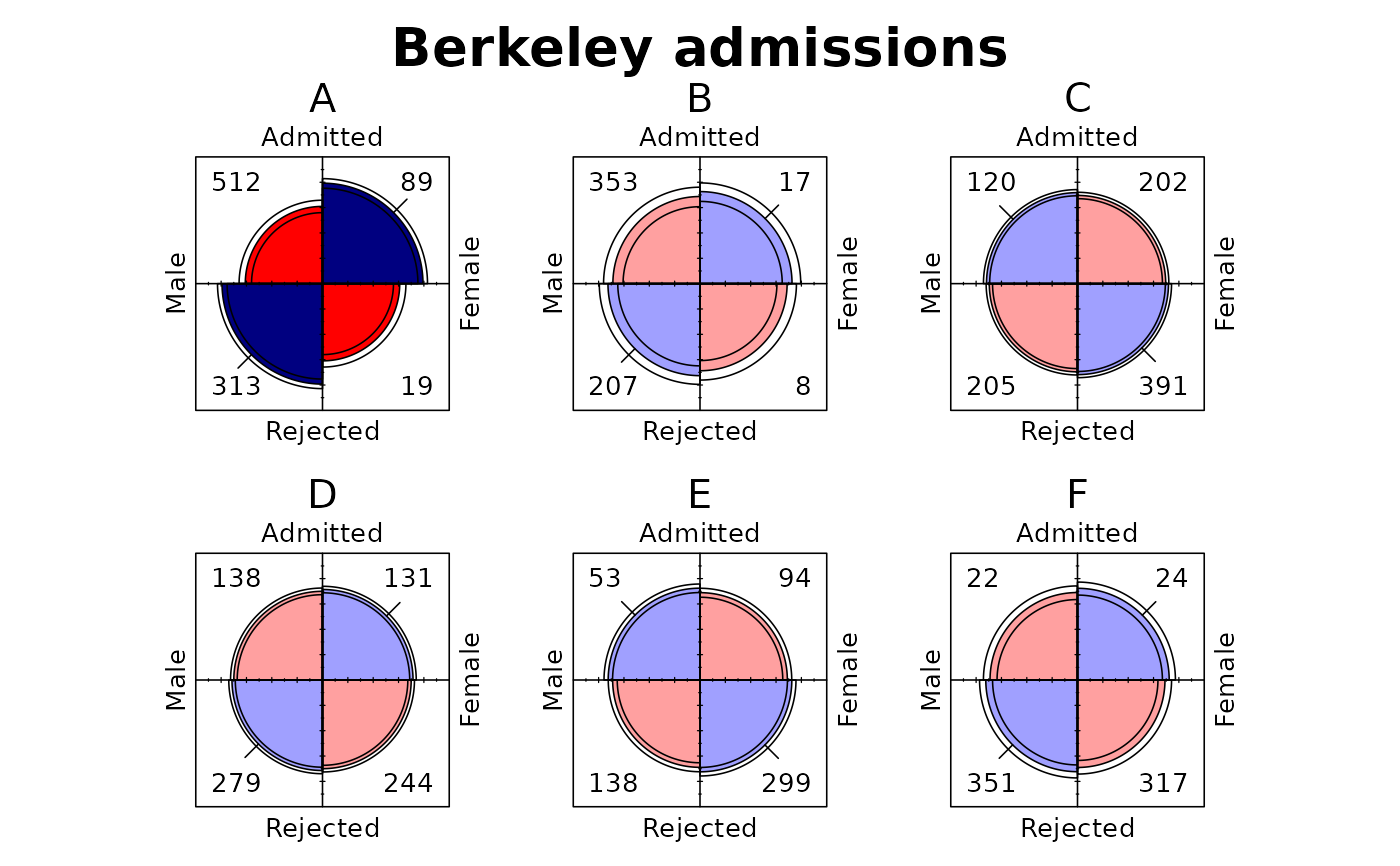
Fourfold displays for 2-by-2 tables
geom_fourfold.Rd`geom_fourfold()` draws a fourfold display in each ggplot2 panel. Sector radii represent cell frequencies after the selected standardization, while sector colours, confidence rings, and direction ticks show the direction and strength of association.
Usage
GeomFourfold

geom_fourfold(
  mapping = NULL,
  data = NULL,
  ...,
  std = c("margins", "ind.max", "all.max"),
  margin = c(1, 2),
  conf_level = 0.95,
  extended = TRUE,
  ticks = 0.15,
  p_adjust_method = stats::p.adjust.methods,
  palette = fourfold_palette(),
  na.rm = FALSE,
  show.legend = FALSE,
  inherit.aes = TRUE
)Arguments
- mapping
Set of aesthetic mappings created by [ggplot2::aes()]. If supplied and `inherit.aes = TRUE`, these are combined with the plot's default mappings.
- data
The data to display in this layer. If `NULL`, the default, the data are inherited from the plot.
- ...
Other arguments passed to [ggplot2::layer()], typically fixed aesthetics such as `colour` or `linewidth`.
- std
Standardization method. `"margins"` fixes the selected margins, `"ind.max"` divides each panel by its largest cell, and `"all.max"` divides every panel by the largest cell in the complete layer.
- margin
Integer vector selecting the table margins when `std = "margins"`. Use `c(1, 2)` for both margins, `1` for the `y` margin, or `2` for the `x` margin.
- conf_level
Confidence level in `[0, 1)`. Set to `0` to suppress confidence rings.
- extended
If `TRUE`, use adjusted p-values to emphasize association and draw direction ticks.
- ticks
Non-negative length of the association direction ticks in the geom's normalized panel coordinates.
- p_adjust_method
Method passed to [stats::p.adjust()] for adjustment across panels. Defaults to `"holm"`, the first value in [stats::p.adjust.methods].
- palette
Character vector of at least six valid colours in the semantic order used by `fourfold_palette()`.
- na.rm
If `FALSE`, the default, missing observations are removed with a warning. If `TRUE`, they are removed silently.
- show.legend
Logical indicating whether this layer should be included in legends. The default is `FALSE` because the semantic fills are not a mapped aesthetic.
- inherit.aes
If `FALSE`, override rather than combine with the plot's default aesthetic mappings.
Details
Map the two-level horizontal variable to `x`, the two-level vertical variable to `y`, and cell frequencies to `weight`. When `weight` is omitted, each row counts as one observation. The first `x` level is drawn on the left and the second on the right; the first `y` level is drawn at the top and the second at the bottom. Set factor levels explicitly when their order matters.
One panel must contain exactly one 2-by-2 table. Use [ggplot2::facet_grid()] or [ggplot2::facet_wrap()] to display stratified tables. Duplicate `x`/`y` combinations within a panel are summed and missing cells are completed with zero counts.
Odds ratios, Wald confidence intervals, and extended-display p-values match the calculations in `vcd::fourfold()`. If any observed cell is zero, 0.5 is added to all four cells for inference. P-values are adjusted across all panels in the layer. Confidence intervals themselves are not adjusted.
The six semantic fill colours are supplied by `palette`; they are not mapped through a ggplot2 fill scale. Typography and layout defaults are controlled by [theme_fourfold()].
Aesthetics
`geom_fourfold()` understands the following aesthetics:
- `x` (required): a variable with exactly two levels. - `y` (required): a variable with exactly two levels. - `weight`: non-negative cell frequencies; defaults to `1`. - `colour`, `linewidth`, `alpha`, `size`, and `family`: fixed or mapped drawing properties. `size` and `family` default to values inherited from the plot theme.
See also
[theme_fourfold()], [fourfold_palette()], [ggplot2::facet_grid()], and [ggplot2::facet_wrap()]
Examples
ucb <- as.data.frame(UCBAdmissions)

ggplot2::ggplot(
  ucb,
  ggplot2::aes(x = Gender, y = Admit, weight = Freq)
) +
  geom_fourfold() +
  ggplot2::facet_wrap(ggplot2::vars(Dept), ncol = 3) +
  ggplot2::labs(title = "Berkeley admissions") +
  theme_fourfold()