Package is a work in progress. Functionality may not work as intended.
A ggplot2 extension that provides a geom and theme for creating fourfold displays. Inspired by the fourfold SAS macro (Friendly, 2000) and vcd R package (Meyer et al., 2026).
Installation
Install the latest version of ggfourfold from GitHub with:
# install.packages("pak")
pak::pak("gklorfine/ggfourfold")
Overview
A fourfold display is a visualization of a \(2 \times 2\) table, or \(2 \times 2 \times k\) tables via faceting. It consists of a circle that is split into quadrants, giving a segment for each cell in the table. In an unstandardized display, these quadrants have area proportional to the sample size of their corresponding cell. Standardized displays … This helps with / affords / … and gives a visual interpretation of the odds ratio, …
Examples
ucb <- as.data.frame(UCBAdmissions)

ggplot(ucb, aes(x = Gender, y = Admit, weight = Freq)) +
  geom_fourfold(std = "ind.max") +  # For unstandardized display
  theme_fourfold()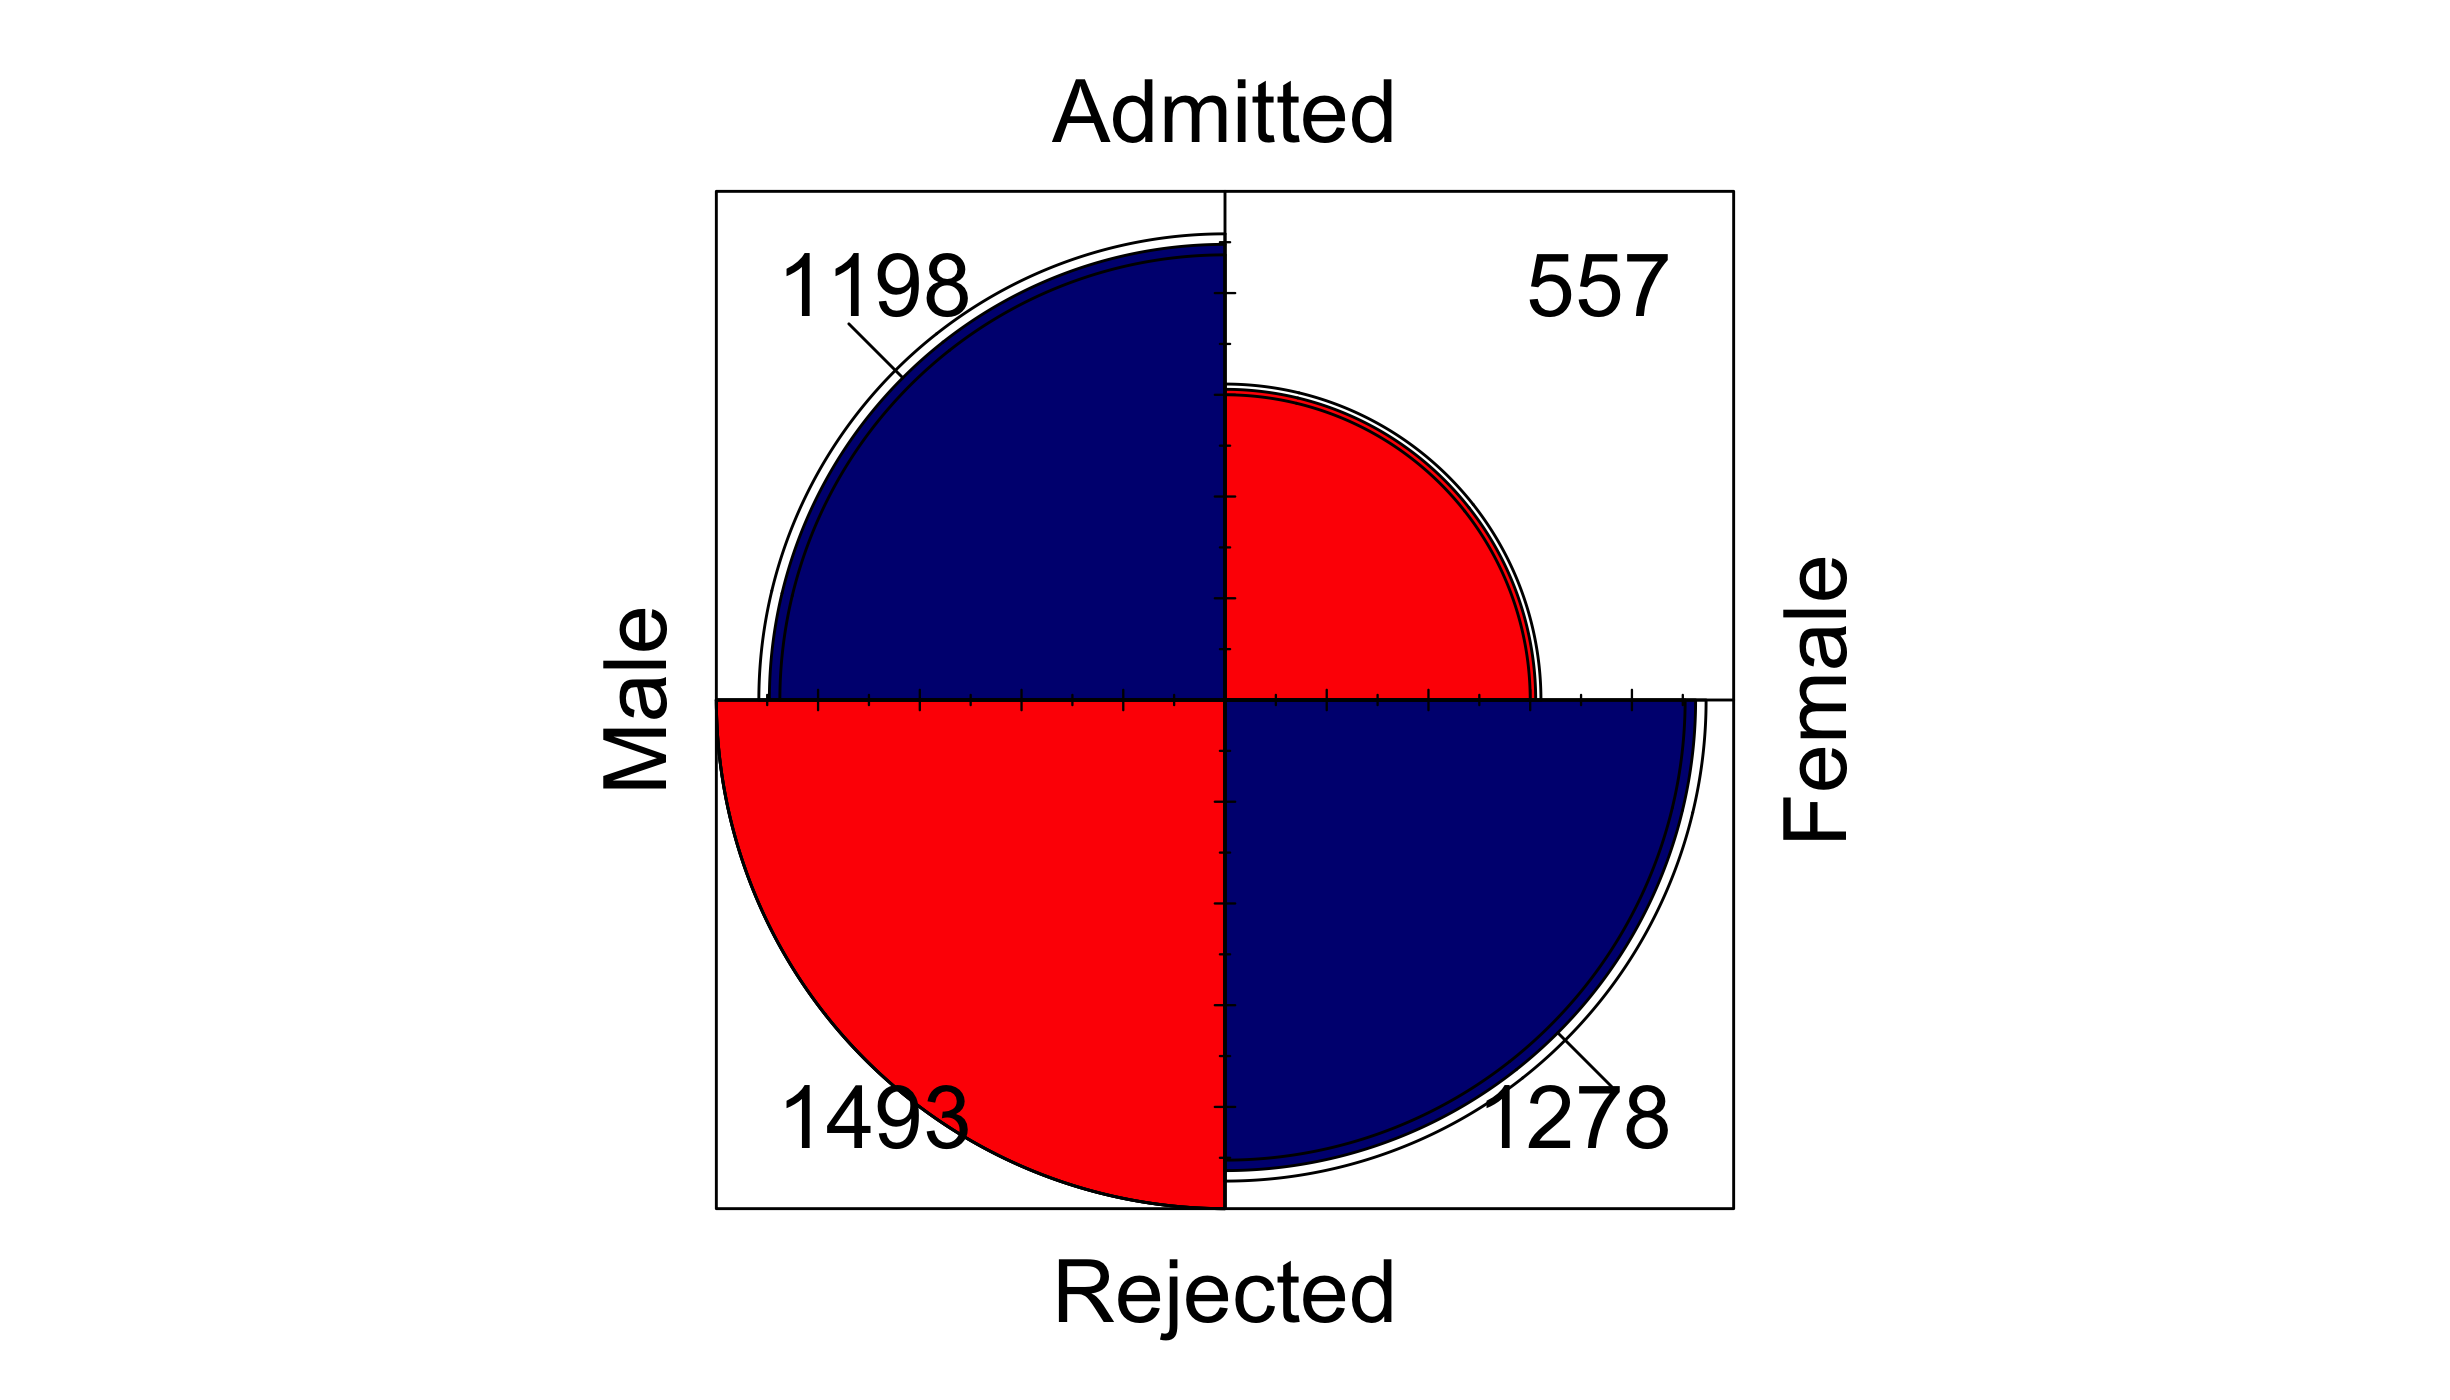
ucb <- as.data.frame(UCBAdmissions)

ggplot(ucb, aes(x = Gender, y = Admit, weight = Freq)) +
  geom_fourfold() +
  theme_fourfold()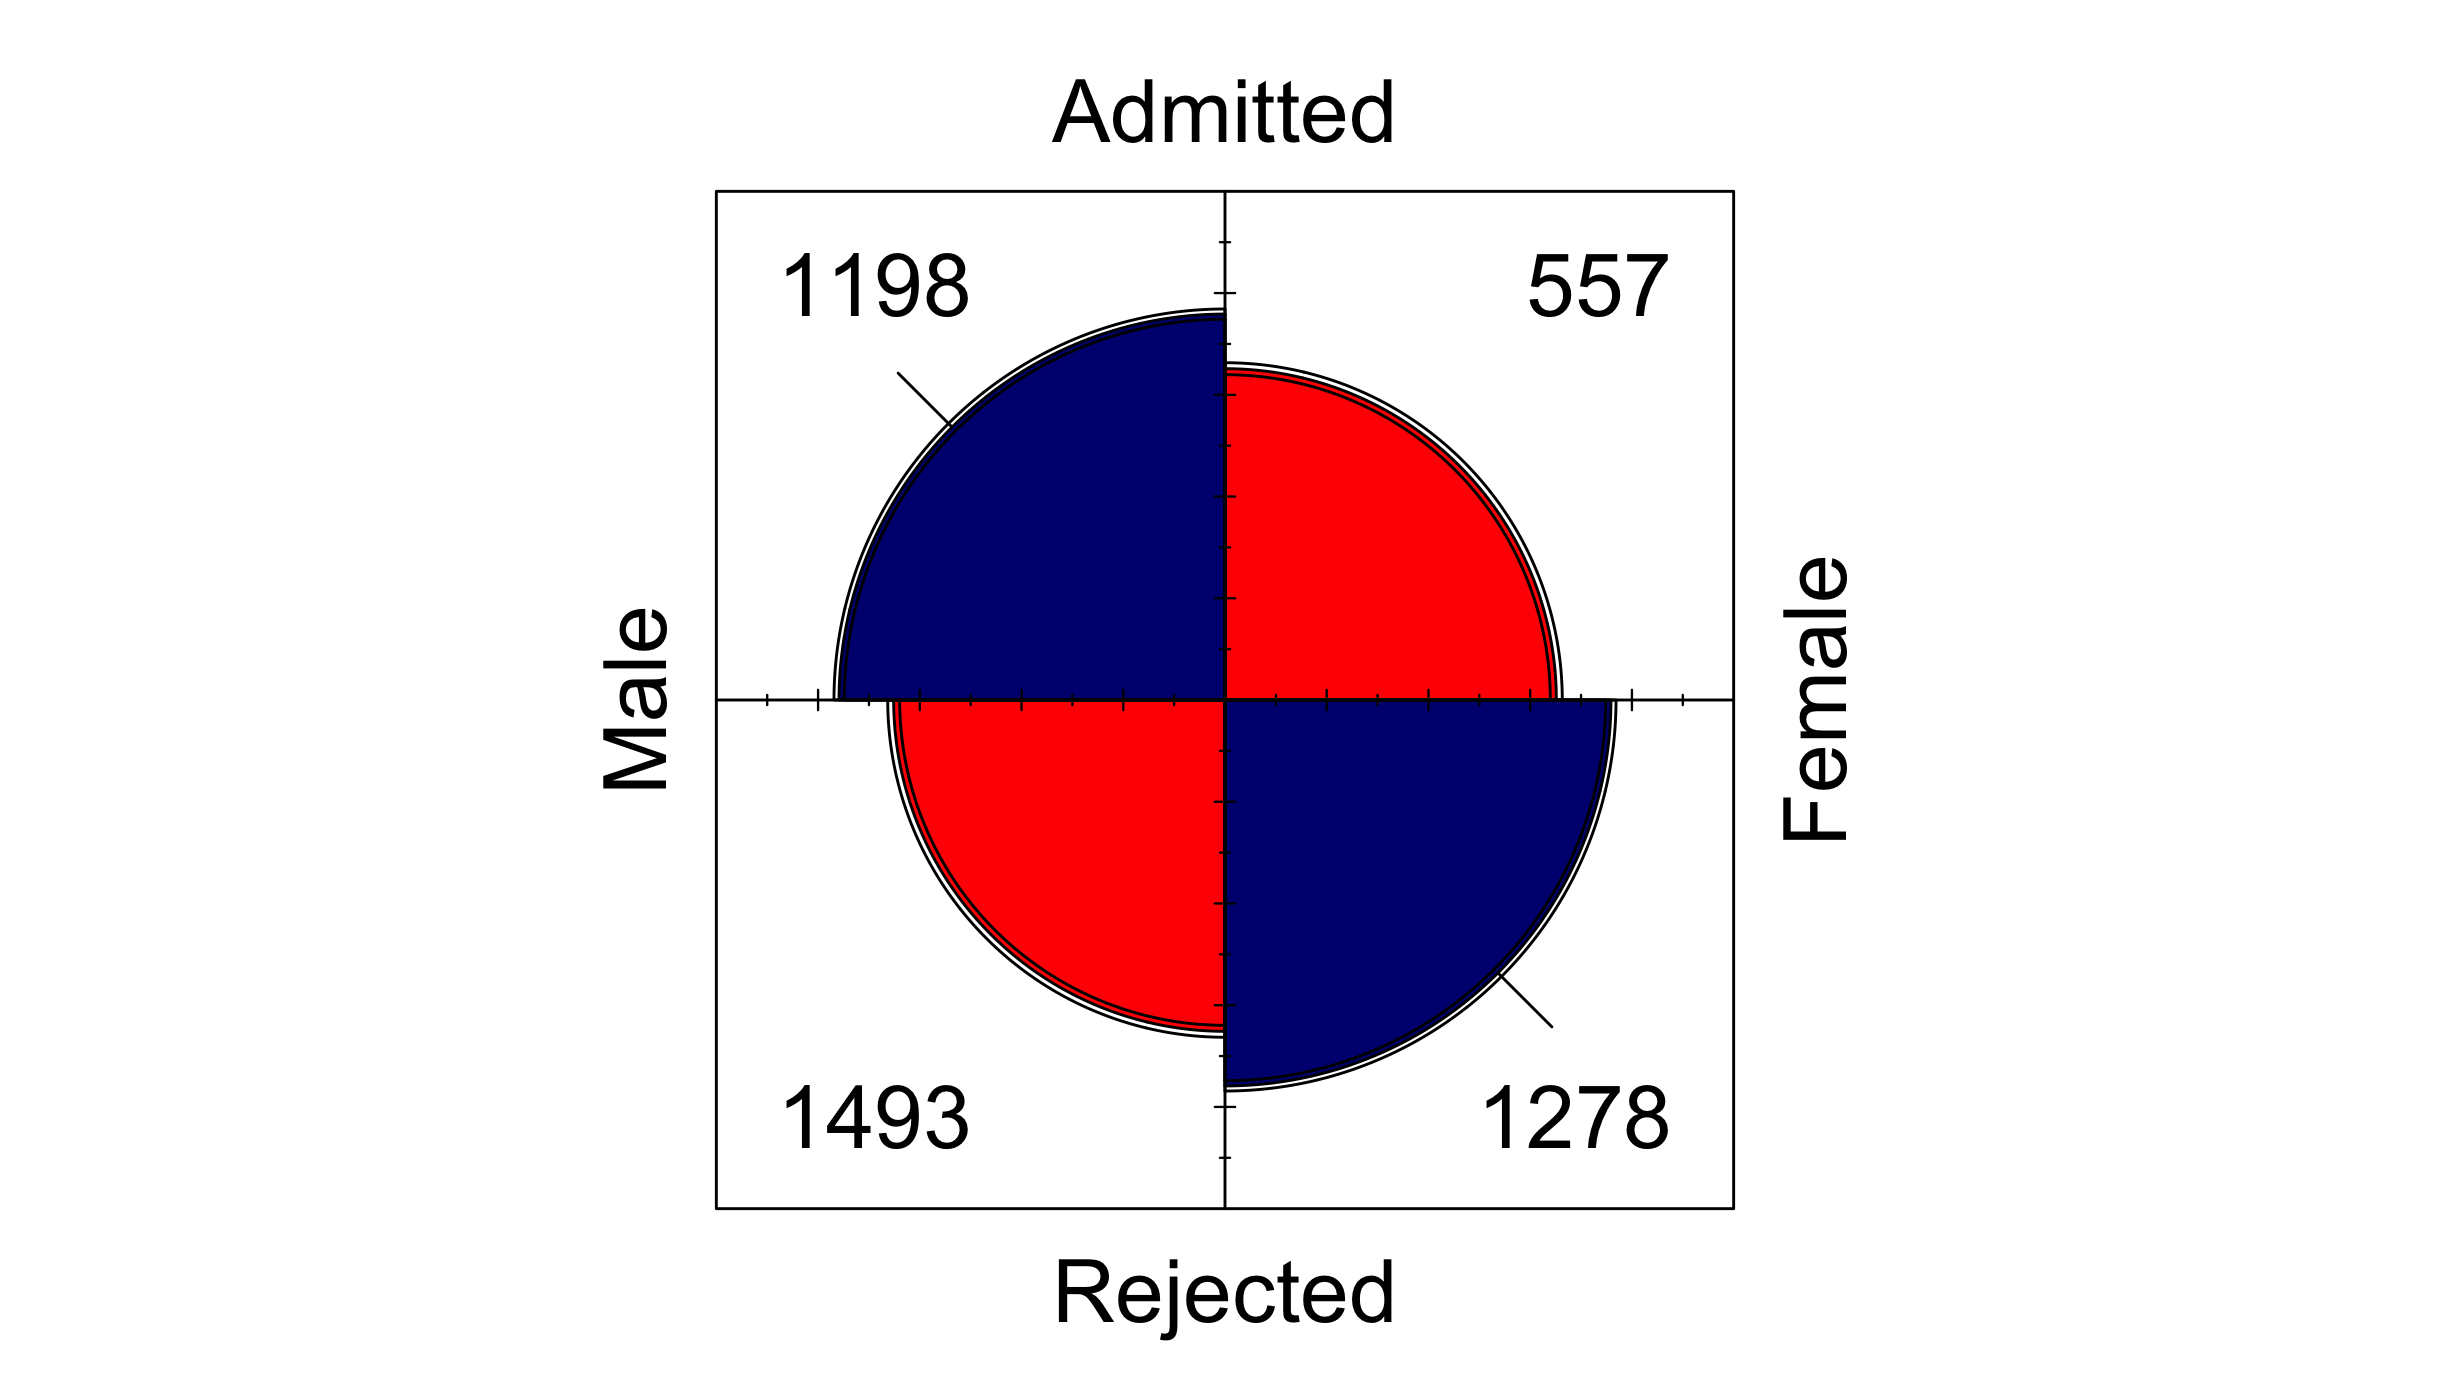
ggplot(ucb, aes(x = Gender, y = Admit, weight = Freq)) +
  geom_fourfold() +
  facet_wrap(vars(Dept), labeller = label_both) +
  theme_fourfold()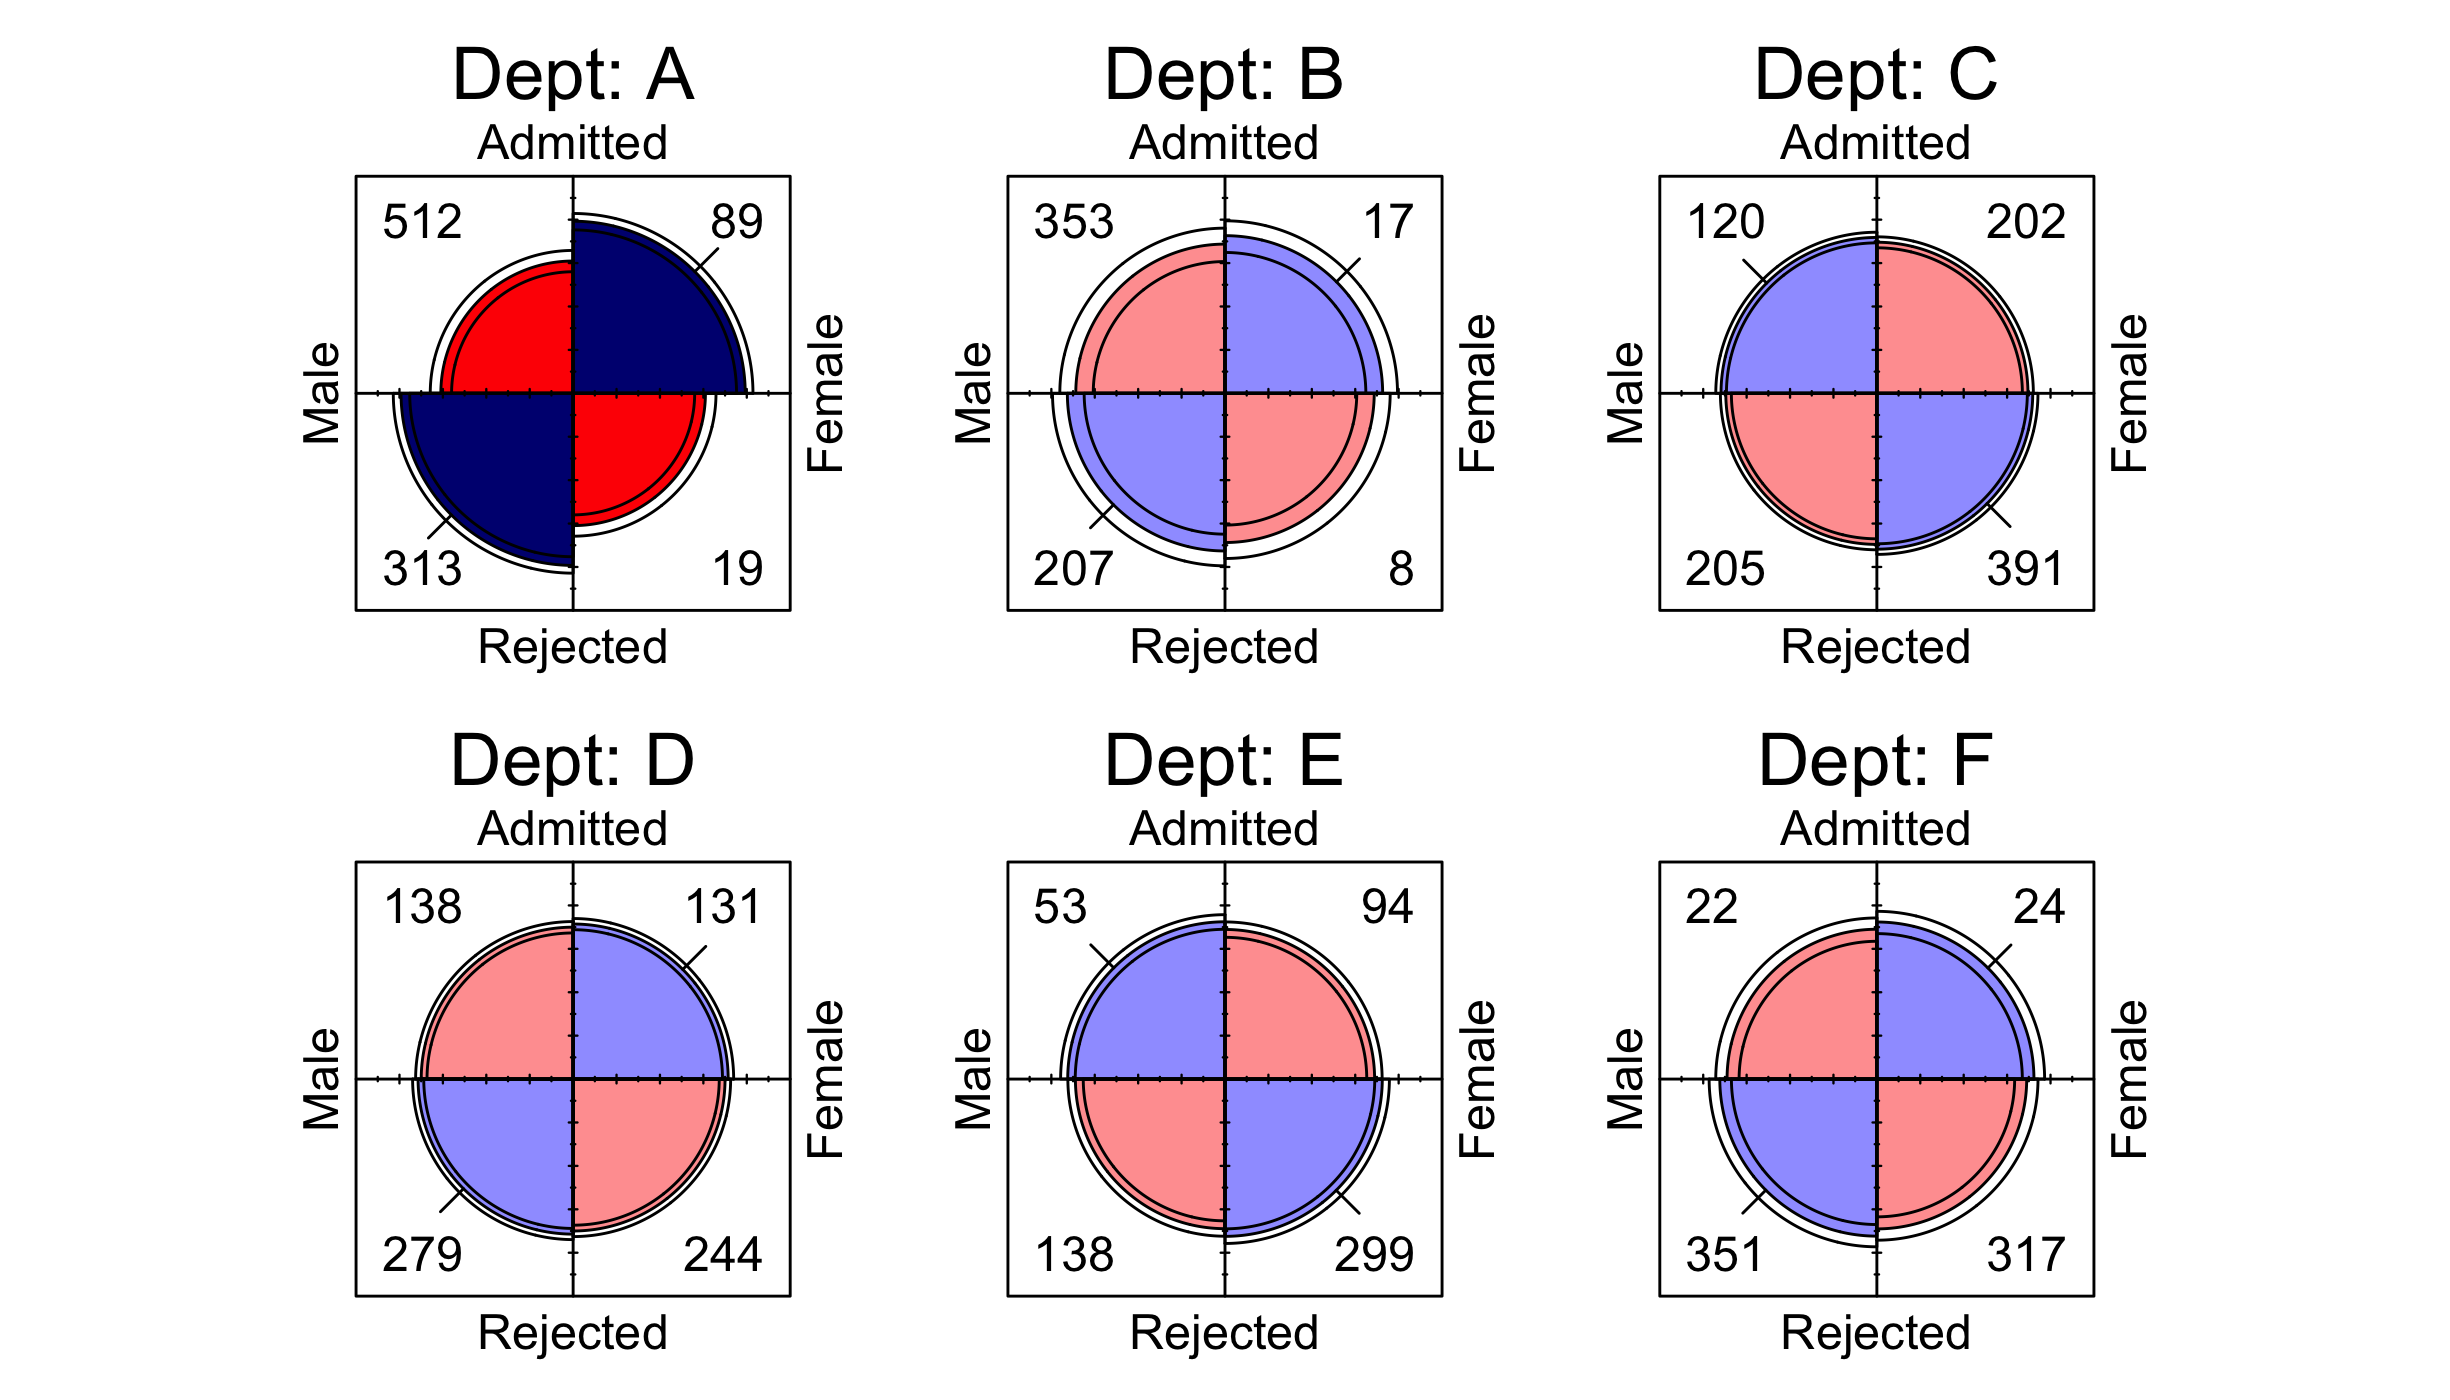
References
Friendly, M. (2000). Visualizing categorical data. SAS Insitute. http://www.math.yorku.ca/SCS/vcd/
Meyer, D., Zeileis, A., Hornik, K., & Friendly, M. (2026). Vcd: Visualizing categorical data. https://doi.org/10.32614/CRAN.package.vcd